
The customer has developed a critical web application that serves as the backbone of our business operations. We seek comprehensive insights into user interactions and infrastructure performance to ensure the application’s reliability, availability, and optimal user experience. To achieve this, we need to set up User and Infrastructure Insights in Azure Application Insights effectively.
So, we have done a few brainstorming sessions, as this project’s scope encompasses configuring Azure Application Insights to collect and analyze user interactions and system-level telemetry data, which includes monitoring user behavior, tracking performance bottlenecks, and ensuring proactive issue detection.
The primary objectives of this project are as follows:
- Instrumentation: Instrument the web application code to send telemetry data to Azure Application Insights.
- User Insights: Collect and analyze user insights, such as page views, custom events, and user-specific data, to understand user behaviour and preferences.
- Infrastructure Insights: Monitor and analyze system-level telemetry, including dependencies, errors, and performance metrics, to identify infrastructure bottlenecks and anomalies.
- Alerting: Configure alerts based on predefined thresholds or anomalies in telemetry data to enable proactive issue detection and response.
- Integration with Azure Monitor (Optional): Integrate Azure Application Insights with Azure Monitor for centralized monitoring and management of Azure resources.
Architecture and Solution
To Set up User and Infrastructure Insights in Azure Application Insights, key considerations of the architecture and app insight components are used. Please find the High-level solution and architecture to achieve the solution.
Solution Architecture: Setting up User and Infra Insights in Azure Application Insights
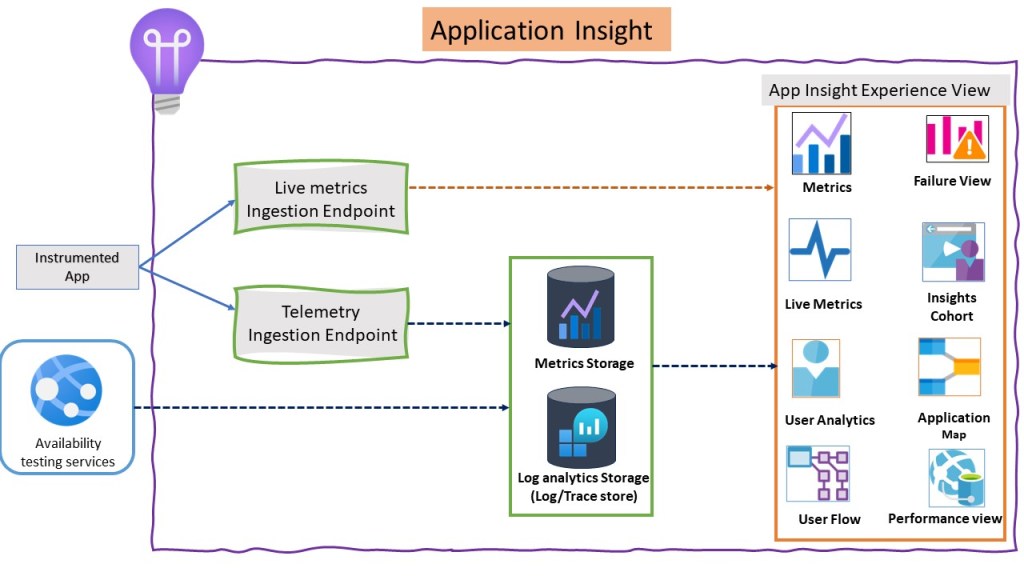
We have outlined the following architecture for the customer to implement the solution. This architecture clearly explains how Azure Application Insights will be utilized.
Upon reviewing the architecture below, it’s evident that we will be utilizing Azure App Services. Within the code of the App Services, we will configure the instrumentation key. Subsequently, the Application Insights agent or SDK will preprocess telemetry and metrics before transmitting this data to Azure. Additionally, Application Insights offers various types of monitoring views for infrastructure monitoring. We will delve into the configuration details in the next section.
Create and Configure the Application Insight
to create an Azure Application Insights resource in the Azure portal. We need to log in to the portal and search for Application Insight.
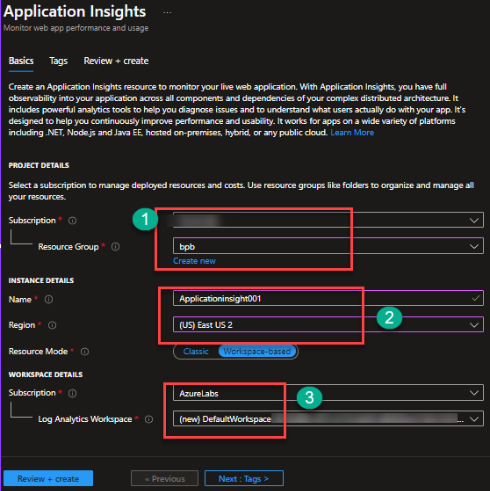
Follow the below steps to create an Application Insight
- Select the appropriate subscription.
- Select the resource group or create a new one.
- Provide the Name of the application.
- Select the region.
- Select the Log Analytics workspace or create one if it wasn’t created earlier.
- Once this is done, click on Next and provide the tags.
- Provide the tag and its value.
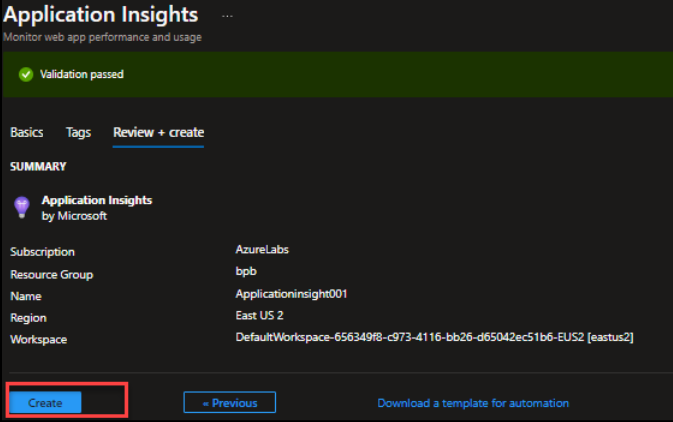
- Then click on Review and Create.
Instrumentation:
- Instrument the web application’s code to collect telemetry data. The choice of instrumentation method depends on the application’s programming language and framework. Common instrumentation methods include:
- Azure Application Insights SDK: Use the Azure Application Insights SDKs for .NET, JavaScript, Java, Python, or other supported languages to instrument your code
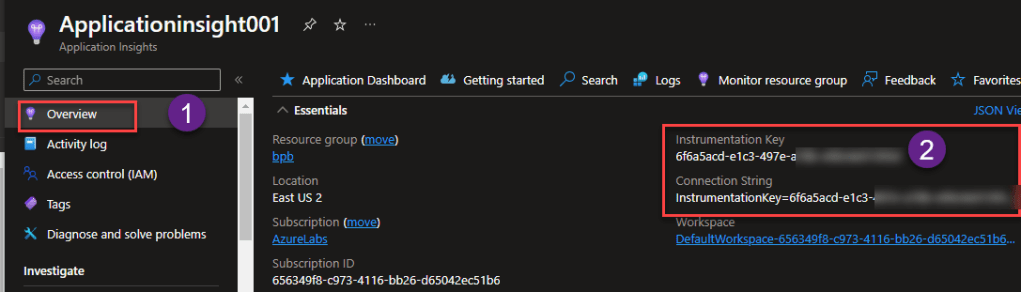
- Go to Application Insight and Click on Overview.
- An Instrumentation key and a connection string are on the left pane.
- Copy the Instrumentation key and put in your application code.
User Insights:
- Implement user insights to monitor user interaction.
- Page Views: Track when users view specific pages or screens within the application.

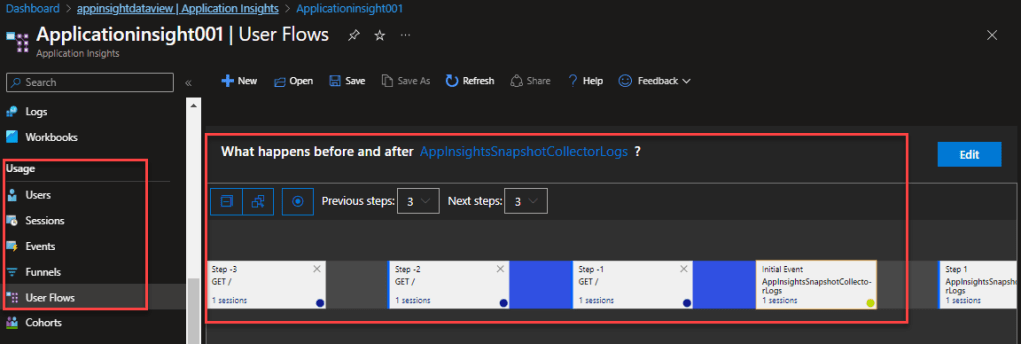
- User Flow: You can view the user flow, how and where my web app events are flowing, and how they’re coming through to get requests.
- Application Mapping: Application mapping helps to understand how business apps have been mapped with apps and databases. It will also show the dependencies connecting to the single instance if you customize and filter it.

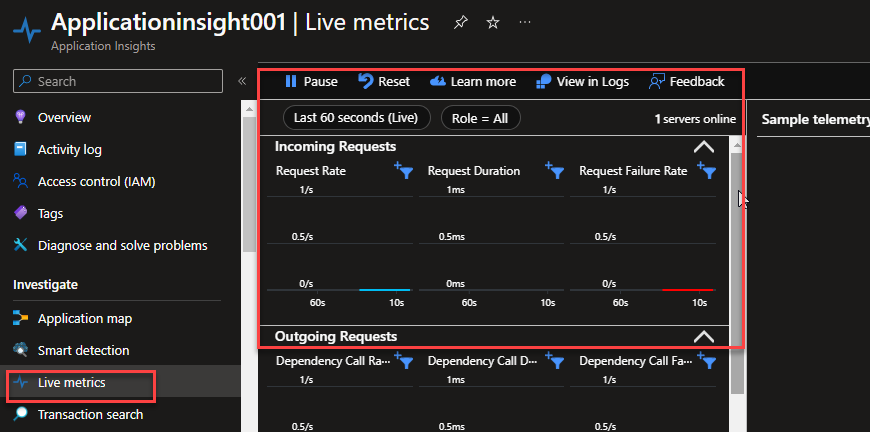
- Live Metrics: It observes the activity of deployed applications in real time without affecting the host environment.
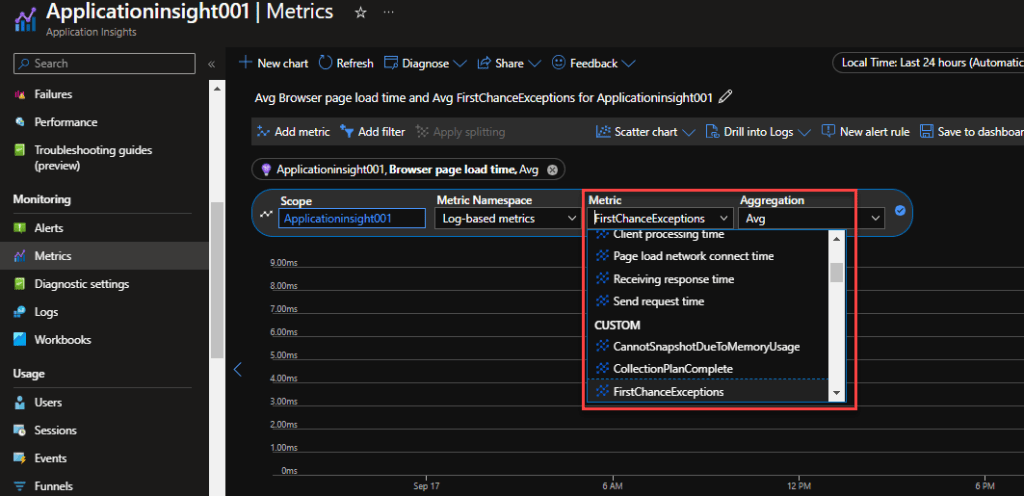
- Matrics: You can customize the matrics dashboard based on your application needs, like page load time, Receiving response time, etc.
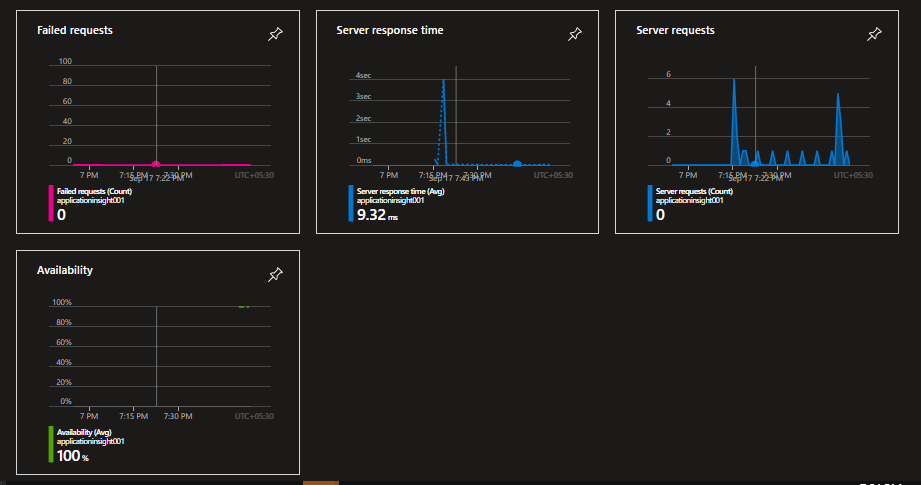
- Once you define the above configuration, your metrics dashboard will look like the one below, where you see the availability time, failure time, etc.
- Performance: Performance is an important criterion for any app service. Application insight provides an in-depth view of your application’s performance, and you can look at the picture below for reference.

In the above configuration session, we have covered almost every feature of app insight that will help manage the user and infrastructure for the monitoring part. A few things you would need to consider below while configuring the solution.
- Instrumentation Complexity: While essential for monitoring, the process of instrumenting application code to capture telemetry data can be intricate and time-consuming. This challenge is particularly pronounced when dealing with legacy applications that may lack built-in telemetry hooks.
- Data Volume Management: Azure Application Insights is designed to capture extensive telemetry data, making it highly effective for in-depth monitoring. However, this capability also poses a challenge.
- Custom Telemetry Challenges: While Azure Application Insights provides pre-built telemetry data collection capabilities, applications often require the capture of custom telemetry data specific to their unique functionality and requirements. Implementing this custom telemetry can be challenging, involving additional development effort and potentially requiring iterative refinement to ensure data accuracy.
Business Benefit
We got multiple benefits once we applied the application insight, and the customer was really appreciative, a few key benefits are below.
- Enhanced User Experience: By gaining insights into user behaviour and preferences, businesses can optimize their applications, leading to improved user experiences. This, in turn, boosts customer satisfaction and loyalty.
- Increased Application Reliability: Monitoring infrastructure and dependencies helps identify bottlenecks and potential issues, allowing for proactive problem resolution. This results in higher application reliability and reduced downtime.
- Faster Issue Resolution: With real-time telemetry data and alerting capabilities, businesses can detect and address issues promptly, minimizing the impact on users and operations.
- Cost Savings: Efficient monitoring helps optimize resource allocation and identify areas where cost savings can be achieved, such as scaling down underutilized resources.
- Data-Driven Decision-Making: Telemetry data provides valuable insights into application performance and usage trends. Businesses can make informed decisions based on data rather than assumptions.
- Improved Developer Productivity: Developers can use telemetry data to pinpoint and resolve issues efficiently, leading to higher productivity and faster feature development.
Author: Lalit, is an Azure MVP, MCT, and author of the “Azure Administrator Exam Prep (Az-104)” and “Azure Interview Q & A” books. He shares his knowledge through his blog and actively engages with the Azure Community around the world. With over 5K training sessions worldwide,.

Leave a comment